Sequence of Analysis

1. Let the market stretch
2. Support / Resistance
3. Price Actions
4. MACD / Stochastic
5. Overbought / oversold - two long candle (hourly / 4H / Daily
Showing posts with label AUD-USD Technical Analysis. Show all posts

Saturday, November 29, 2014

EUR-USD and GBP-USD Technical (1 - 5 December 2014)

MACD Settings:- First EMA = 12 | Second EMA = 26 | Signal EMA = 9
Stochastic Settings:- Period = 5 | Average Period Fast = 7 | Average Period Full =7
Bollinger Bands Settings:- Average = 20 | Standard Deviation = 2
Date: 29 November 2014
Time: 8:05 PM (+8 GMT)


EUR-USD
Technical.Indicators 4 Hourly Daily Weekly Monthly
MACD UP UP DOWN DOWN
Full Stochastic UP DOWN UP DOWN
Bollinger Bands N/A N/A N/A N/A
Chart Formation N/A N/A N/A N/A
Market Direction UP NEUTRAL NEUTRAL DOWN
Market Comments In short term EUR-USD fluctuation is very much neutral last week from 24 to 28 November 2014 as it goes up for correction at 1.2529 and then it goes down to 50% retracement at 1.24511. This 50% retracement where will the EUR-USD market goes to next week?

Fundamental Perspective
Forexfactory economic calender records from 1 to 5 December 2014 could be another week for high turbulence as there mix economic data between the US and Economic.

Technical Perspective

From technical perspective we can see that the entire trend is going down as shown by the MACD and Stochastic from monthly time frame. However in the intermediate and short term both indicators are going against each other which means the fluctuation could be neutral either ups or down. This is another factor that could confirm the turbulence fluctuation next week.

Fluctuation Range:
High = 1.2529
Low = 1.2361

4 Hourly Chart for EUR-USD showing the current position standing at 50% retracement level.


GBP-USD
Technical.Indicators 4 Hourly Daily Weekly Monthly
MACD DOWN UP DOWN DOWN
Full Stochastic DOWN UP DOWN DOWN
Bollinger Bands N/A N/A N/A N/A
Chart Formation N/A N/A N/A N/A
Market Direction DOWN UP DOWN DOWN
Market Comments Last week movement the GBP-USD make up correction to a new high at 1.58154 but then went down to the previous low at 1.5627. As the MACD and Stochastic in the daily time frame still going up there is strong chance it may go up temporarily at least 50% from the current position. However the intermediate and long term are both indicating down trend, there will be strong risk to play upside position. Where will it move next week?

Fundamental Perspective:
Mix economic data may cause an unpredictable situation, playing upside would be most unfavorable because of the risk of the major downtrend. Bad economic data from the UK could push the market even deeper down. Otherwise it will retrace at 50% from the current position

Technical Perspective:
In daily time frame there is still hope of going up at the very least up to 50% from the current position as MACD and Stochastic still synced upwards direction. However on the weekly and monthly time frame it is obvious the pair is going down big time.

Range of Fluctuation

High = 1.5815
Mid = 1.5712
Low = 1.5627

4 Hourly Chart for GBP-USD showing it is currently standing at the previous low level at 1.56271

Saturday, May 18, 2013

Forex Technical Analysis (19 May 2013) - Next Week Outlook

MACD Settings:- First EMA = 12 | Second EMA = 26 | Signal EMA = 9
Stochastic Settings:- Period = 5 | Average Period Fast = 7 | Average Period Full =7
Bollinger Bands Settings:- Average = 20 | Standard Deviation = 2
Date: 19 May 2013
Time: 10:19 AM (+8 GMT)

EUR-USD
Technical Indicators 4 Hourly Daily Weekly Monthly
MACD Up Down Down Up
Full Stochastic Down Down Up Down
Bollinger Bands N/A N/A N/A N/A
Chart Formation N/A N/A Head/Shoulder Flag
Market Direction Neutral Down Neutral Neutral
Market Comments As discussed here (Forex Technical Analysis) Now that the Head/Shoulder formation is becoming obvious in the weekly time frame and MACD/Stochastic indicators also almost synced downward direction. There is strong indication downtrend is about to continue its course of direction. All along next week could be a major downfalls with the expected price target should be around 1.26XX


AUD-USD
Technical Indicators 4 Hourly Daily Weekly Monthly
MACD Down Down Down Down
Full Stochastic Down Down Down Down
Bollinger Bands Bottom Bottom Bottom Bottom
Chart Formation N/A N/A N/A N/A
Market Direction Down Down Down Down
Market Comments As discussed last week (AUD-USD Weekly outlook) the second candle has been formed as expected in the weekly time frame. Sitting at the strong resistant level the movement still have some more gas to go further down as MACD/Stochastic signal still goes down in the monthly time frame. This is the trickiest pair to trade but i have we must believe this time it should go down beyond the resistant 0.97XX


USD-CAD
Technical Indicators 4 Hourly Daily Weekly Monthly
MACD Up Up Up Up
Full Stochastic Up Up Down Up
Bollinger Bands Top Top Top Top
Chart Formation N/A N/A N/A Head/Shoulder
Market Direction Up Up Neutral Up
Market Comments All the major time frame MAC/Stochastic already point upwards. Supported by Head/Shoulder formation (reverse) in the monthly time frame and also the squeezing size of the bollinger band. The major breakout that all has been waiting for is about to burst.The month of May should be bullish all along and nothing can stop it this time. The target could be as high as 1.21XX with the estimated volume of 1900 pips altogether. We will wait and see.


Monday, May 13, 2013

AUD-USD Weekly Technical Analysis (13 May 2013)

MACD Settings:- First EMA = 12 | Second EMA = 26 | Signal EMA = 9
Stochastic Settings:- Period = 5 | Average Period Fast = 7 | Average Period Full =7
Bollinger Bands Settings:- Average = 20 | Standard Deviation = 2
Date: 13 May 2013
Time: 9:48 PM (+8 GMT)

AUD-USD
Technical Indicators 4 Hourly Daily Weekly Monthly
MACD Down Down Down Down
Full Stochastic Up Down Down Down
Bollinger Bands Bottom Bottom Bottom Bottom
Chart Formation N/A N/A N/A N/A
Market Direction Neutral Down Down Down
Market Comments MACD and Stochastic both goes down in Weekly time frame supported by Daily and Monthly Time Frame. Going short for AUD-USD with the expected target at at least at 0.9810 by the end of this week. We wait and see if this is true.


Sunday, July 15, 2012

Daily Technical Analysis - 15 Jul 2012

MACD Settings:- First EMA = 12 | Second EMA = 26 | Signal EMA = 9
Stochastic Settings:- Period = 5 | Average Period Fast = 7 | Average Period Full =7
Bollinger Bands Settings:- Average = 20 | Standard Deviation = 2

Date: 15 July 2012
Time: 12:29 PM (+8 GMT)

EUR-USD
Technical Indicators 4 Hourly Daily Weekly Monthly
MACD Up  Down Down Down
Full Stochastic Up Down Up Down
Bollinger Bands Middle Bottom Bottom Bottom
Chart Formation Unknown Unknown Head/Shoulder Flag Downward
Market Direction Up Down Down Down
Market Comments Overall direction is down trend

GBP-USD
Technical Indicators 4 Hourly Daily Weekly Monthly
MACD Up Up Down Up
Full Stochastic Up Down Up Up
Bollinger Bands Top Middle Bottom Bottom
Chart Formation Unknown Head/Shoulder Unknown Head/Shoulder
Market Direction Up Neutral Neutral Neutral
Market Comments The quiet movement keeps market flat but beware of major downtrend

GBP-JPY
Technical Indicators 4 Hourly Daily Weekly Monthly
MACD Up Up Down Up
Full Stochastic Up Down Up Up
Bollinger Bands Top Bottom Bottom Bottom
Chart Formation Unknown Head/Shoulder Head/Shoulder Unknown
Market Direction Up Neutral Neutral Neutral
Market Comments As the market already already at the bottom, the major trend is flat.

EUR-JPY
Technical Indicators 4 Hourly Daily Weekly Monthly
MACD Up Down Down Flat
Full Stochastic UP Down Up Up
Bollinger Bands Middle Bottom Bottom Bottom
Chart Formation Unknown Head/Shoulder Head/Shoulder Head/Shoulder
Market Direction Up Down Down Down
Market Comments The major trend is - gradual downtrend

AUD-USD
Technical Indicators 4 Hourly Daily Weekly Monthly
MACD Up Up Up Down
Full Stochastic Up Up Up Down
Bollinger Bands Middle Top Middle Middle
Chart Formation Unknown Head/Shoulder Head/Shoulder Unknown
Market Direction Up Up Up Down
Market Comments Despite of all the short and intermediate term goes uptrend the long-term is downtrend

USD-CAD
Technical Indicators 4 Hourly Daily Weekly Monthly
MACD Down Down Up Up
Full Stochastic Down Up Down Down
Bollinger Bands Bottom Bottom Top Top
Chart Formation Unknown Unknown Unknown Head/Shoulder
Market Direction Down Neutral Neutral Neutral
Market Comments The long-term future is major up-trend

Saturday, June 9, 2012

Daily Technical Analysis - 10 Jun 2012

MACD Settings:- First EMA = 12 | Second EMA = 26 | Signal EMA = 9
Stochastic Settings:- Period = 5 | Average Period Fast = 7 | Average Period Full =7
Bollinger Bands Settings:- Average = 20 | Standard Deviation = 2

Date: Sunday 10 June 2012
Time: 10:01 AM (+8 GMT)

EUR-USD
Technical Indicators 4 Hourly Daily Weekly Monthly
MACD Down Up Down Down
Full Stochastic Down Up Down Down
Bollinger Bands Middle Middle Bottom Bottom
Chart Formation Head/Shoulder Unknown Head/Shoulder Flag Downward
Market Direction Down Up Down Down
Market Comments Correction in the short-term but long-term is going downtrend

GBP-USD
Technical Indicators 4 Hourly Daily Weekly Monthly
MACD Down Down Down Up
Full Stochastic Down Up Down Down
Bollinger Bands Middle Bottom Bottom Bottom
Chart Formation Head/Shoulder Unknown Sideway trend Head/Shoulder
Market Direction Down Neutral Down Neutral
Market Comments Short-term down but long-term is neutral sideway trend waiting downtrend breakout

GBP-JPY
Technical Indicators 4 Hourly Daily Weekly Monthly
MACD Up Down Down Up
Full Stochastic Down Up Down Up
Bollinger Bands Middle Middle Bottom Bottom
Chart Formation Uptrend Double Top Sideway trend Sideway down trend
Market Direction Neutral Neutral Down Up
Market Comments The short-term is making re-tracement and long-term sideway downward trend

EUR-JPY
Technical Indicators 4 Hourly Daily Weekly Monthly
MACD Down Up Down Neutral
Full Stochastic Down Up Down Neutral
Bollinger Bands Middle Middle Bottom Bottom
Chart Formation Upward trend Double Top Sideway trend Sideway trend
Market Direction Down Up Down Neutral
Market Comments Short-term correction but long-term is sideway down trending

AUD-USD
Technical Indicators 4 Hourly Daily Weekly Monthly
MACD Down Up Down Down
Full Stochastic Down Up Down Down
Bollinger Bands Middle Top Bottom Bottom
Chart Formation Up trend Double Top Double Top Double Top
Market Direction Down Up Down Down
Market Comments Short-term correction and long-term is initiating downtrend

Sunday, May 27, 2012

Daily Technical Analysis - 28 May 2012

MACD Settings:- First EMA = 12 | Second EMA = 26 | Signal EMA = 9
Stochastic Settings:- Period = 5 | Average Period Fast = 7 | Average Period Full =7
Bollinger Bands Settings:- Average = 20 | Standard Deviation = 2

Date: 28 May 2012
Time: 9:23 AM (+8 GMT)

EUR-USD
Technical Indicators 4 Hourly Daily Weekly Monthly
MACD Up Down Down Down
Full Stochastic Up Down Down Up
Bollinger Bands Middle Bottom Bottom Bottom
Chart Formation Rally Down Flag Downward Flag Downward Flag Down
Market Direction Up Down Down Neutral
Market Comments Short-term and Long-term down trend

GBP-USD
Technical Indicators 4 Hourly Daily Weekly Monthly
MACD Up Down Down Up
Full StochasticUp Down Down Up
Bollinger Bands Middle Bottom Middle Middle
Chart Formation Rally Downward Flag Upward Head/Shoulder Head/Shoulder
Market Direction Down Down Sideway Trending Sideway trending
Market Comments Short-term downtrend | Long-term sideway and downtre

GBP-JPY
Technical Indicators 4 Hourly Daily Weekly Monthly
MACD Up Down Down Up
Full Stochastic Down Down Down Up
Bollinger Bands Middle Bottom Middle Middle
Chart Formation Rally Downward Head/Shoulder Sideway trending Sideway trending
Market Direction Down Down Down Up
Market Comments Sideway trending gradual downwards

EUR-JPY
Technical Indicators 4 Hourly Daily Weekly Monthly
MACD Up Down Down Up
Full Stochastic Down Down Down Down
Bollinger Bands Middle Bottom Bottom Bottom
Chart Formation Rally Down Head/Shoulder Flag Downward Flag Downward
Market Direction Neutral Down Down Neutral
Market Comments Short-term downtrend and Long-term sideway downward

AUD-USD
Technical Indicators 4 Hourly Daily Weekly Monthly
MACD Up Down Down Down
Full Stochastic Up Up Down Down
Bollinger Bands Top Bottom Bottom Bottom
Chart Formation Rally Downward Head/Shoulder Double Top Flag Upward
Market Direction Up Neutral Down Down
Market Comments Short and Intermediate term goes down but the true direction based on chart formation is upward trending

USD-CAD
Technical Indicators 4 Hourly Daily Weekly Monthly
MACD Down Up Up Up
Full Stochastic Down Up Up Up
Bollinger Bands Middle Top Top Top
Chart Formation Rally Up Unknown Sideway Double Bottom Double Bottom
Market Direction Down Up Up Up
Market Comments The pair is waiting for major break out for uptrend

Friday, May 18, 2012

Daily Technical Analysis - 19 May 2012

MACD Settings:- First EMA = 12 | Second EMA = 26 | Signal EMA = 9
Stochastic Settings:- Period = 5 | Average Period Fast = 7 | Average Period Full =7
Bollinger Bands Settings:- Average = 20 | Standard Deviation = 2

Date: 19 May 2012
Time: 11:38 AM (+8 GMT)

EUR-USD
Technical Indicators 4 Hourly Daily Weekly Monthly
MACD Up Down Up Down
Full Stochastic Up Up Down Down
Bollinger Bands Top Bottom Bottom Bottom
Chart Formation Unknown Head/Shoulder Head/Shoulder Flag Downward
Market Direction Up Down Down Down
Market Comments Short-term upward retracement while the intermediate term is neutral and long-term is downtrend

GBP-USD
Technical Indicators 4 Hourly Daily Weekly Monthly
MACD Up Down Up Up
Full Stochastic Up Down Up Up
Bollinger Bands Middle Bottom Middle Middle
Chart Formation Head/Shoulder Gradual upward Double Top Head/Shoulder
Market Direction Up Down Up Up
Market Comments Short-term is retracement downward while the intermediate is upward and long term is gradual sideway uptrend. The bollinger band in Monthly time frame is squeezing smaller - which indicates sign of breakout. 

GBP-JPY
Technical Indicators 4 Hourly Daily Weekly Monthly
MACD Down Down Up Up
Full Stochastic Up Down Down Up
Bollinger Bands Bottom Bottom Middle Middle
Chart Formation Rally downward Double Top Double Bottom Unknown
Market Direction Down Down Neutral Up
Market Comments This is odd pair. Despite of the long-term indicators all showing upward the market is moving downtrend. However the Bollingerband is getting squeezed which indicate a sign of breakout anytime soon most probably uptrend.

EUR-JPY
Technical Indicators 4 Hourly Daily Weekly Monthly
MACD Down Down Down Up
Full Stochastic Down Down Down Up
Bollinger Bands Bottom Bottom Middle Bottom
Chart Formation Rally downtrend Head/Shoulder Rally downtrend Rally downtrend
Market Direction Down Down Down Up
Market Comments The short-term all heading downtrend. In the long-term is gradual sideway downtrend 

AUD-USD
Technical Indicators 4 Hourly Daily Weekly Monthly
MACD Down Down Down Down
Full Stochastic Down Down Down Down
Bollinger Bands Bottom Bottom Bottom Middle
Chart Formation Rally Downtrend Head/Shoulder Double Top Rally Uptrend
Market Direction Down Down Down Down
Market Comments All indicators showing downtrend but the true direction of this pair based on the long-term (monthly time frame) is showing uptrend. Currently there are only 2 peaks of the flag for the long-term and 1 peak left to go. So there is still strong fuel of trend in the long-term.

USD-CAD
Technical Indicators 4 Hourly Daily Weekly Monthly
MACD Up Up Up Up
Full Stochastic Up Up Up Down
Bollinger Bands Top Top Top Top
Chart Formation Rally Uptrend Rally Uptrend Double Bottom Double Bottom
Market Direction Up Up Up Up
Market Comments All short-term showing uptrend and the Bollinger Band is also squeezing. This may indicate major long-term uptrend in the near future.

Thursday, May 17, 2012

Daily Technical Analysis - 17 May 2012

MACD Settings:- First EMA = 12 | Second EMA = 26 | Signal EMA = 9
Stochastic Settings:- Period = 5 | Average Period Fast = 7 | Average Period Full =7
Bollinger Bands Settings:- Average = 20 | Standard Deviation = 2

Date: 17 May 2012
Time: 11:19 PM (+8 GMT)

EUR-USD
Technical Indicators 4 Hourly Daily Weekly Monthly
MACD Up Down Down Down
Full Stochastic Up Down Down Down
Bollinger Bands Bottom Bottom Bottom Bottom
Chart Formation Gradual downtrend Head/Shoulder Head/Shoulder Flag Downtrend
Market Direction Up Down Down Down
Market Comments Short Term and Long-term downtrend

GBP-USD
Technical Indicators 4 Hourly Daily Weekly Monthly
MACD Down Down Up Up
Full Stochastic Down Down Down Up
Bollinger Bands Bottom Bottom Middle Middle
Chart Formation Head/Shoulder Flag UptrendSideway Trending Head/Shoulder
Market Direction Down DownNeutral Sideway Up
Market Comments The trend is moving sideway but the major breakout waiting for downtrend

GBP-JPY
Technical Indicators 4 Hourly Daily Weekly Monthly
MACD Down Down Up Up
Full Stochastic Down Down Down Up
Bollinger Bands Bottom Bottom Middle Middle
Chart Formation Gradual Downtrend Double Top Sideway downtrend Gradual downtrend
Market Direction Down Down Neutral  Up
Market Comments Gradual sideway downtrend waiting for the long-term major breakout uptrend

EUR-JPY
Technical Indicators 4 Hourly Daily Weekly Monthly
MACD Down Down Down Up
Full Stochastic Down Down Down Up
Bollinger Bands Bottom Bottom Middle Bottom
Chart Formation Rally downtrend Head/Shoulder Sideway downtrend Double Bottom
Market Direction Down Down Down Down
Market Comments Market is gradually going down and waiting for the major breakout in long-term

AUD-USD
Technical Indicators 4 Hourly Daily Weekly Monthly
MACD Up Down Down Down
Full Stochastic Up Down Down Down
Bollinger Bands Middle Bottom Bottom Middle
Chart Formation Gradual downtrend Head/Shoulder Double Top Flag Uptrend
Market Direction Up Down Down Down
Market Comments This is tricky - indicators shows downtrend but the true movement is uptrend

USD-CAD
Technical Indicators 4 Hourly Daily Weekly Monthly
MACD Up Up Up Up
Full Stochastic Up Up Up Down
Bollinger Bands Top Top Top Middle
Chart Formation Rally Uptrend Unknown UnknownDouble Bottom
Market Direction Up Up Up Neutral
Market Comments At the bottom of downtrend and there is strong possibility of uptrend in long term

Monday, May 14, 2012

Daily Technical Analysis - 15 May 2012

MACD Settings:- First EMA = 12 | Second EMA = 26 | Signal EMA = 9
Stochastic Settings:- Period = 5 | Average Period Fast = 7 | Average Period Full =7
Bollinger Bands Settings:- Average = 20 | Standard Deviation = 2

Date: 15 May 2012
Time: 9:12 AM (+8 GMT)

EUR-USD
Technical Indicators 4 Hourly Daily Weekly Monthly
MACD Down Down Up Down
Full Stochastic Down Down Down Down
Bollinger Bands Bottom Bottom Bottom Bottom
Chart Formation Rally downward Flag Downward Head/Shoulder Flag Downward
Market Direction Down Down Down Down
Market Comments Short-Term Down | Long-term Down

GBP-USD
Technical Indicators 4 Hourly Daily Weekly Monthly
MACD Down Down Up Up
Full Stochastic Down Down Up Up
Bollinger Bands Middle Middle Top Middle
Chart Formation Flag Downward Flag Upward Flag Upward Head/Shoulder
Market Direction Down Down Up Up
Market Comments Short-Term Down | Long-Term Gradual and Up

GBP-JPY
Technical Indicators 4 Hourly Daily Weekly Monthly
MACD Up Down Up Up
Full Stochastic Up Up Down Up
Bollinger Bands Middle Bottom Middle Middle
Chart Formation Flag Downward Flag Downward Sideway Trending Sideway Trend
Market Direction Down Down Up Up
Market Comments Short-Term Up | Long-term downward and sideway trending

EUR-JPY
Technical Indicators 4 Hourly Daily Weekly Monthly
MACD Down Down Down Up
Full Stochastic Down Down Down Up
Bollinger Bands Bottom Bottom Middle Bottom
Chart Formation Rally Downward Head/Shoulder Sideway Downward Trend Head/Shoulder
Market Direction Down Down Down Down
Market Comments Short-term and Long-term gradual sideway downtrend 

AUD-USD
Technical Indicators 4 Hourly Daily Weekly Monthly
MACD Down Down Down Down
Full Stochastic Down Down Down Down
Bollinger Bands Bottom Bottom Bottom Middle
Chart Formation Rally Downward Head/Shoulder Double Top Upward Trend
Market Direction Down Down Down Down
Market Comments Short and Intermediate term down | Long-term upward trending

USD-CAD
Technical Indicators 4 Hourly Daily Weekly Monthly
MACD Down Up Down Up
Full Stochastic Down Up Up Down
Bollinger Bands Top Top Middle Middle
Chart Formation Rally Upward Sideway trend Sideway Trend Double Bottom
Market Direction Up Up Neutral Neutral
Market Comments Short-term Upward movement | Long-term neutral and possibly breakout up

Monday, December 6, 2010

Gold Price and AUD-USD correlation analysis

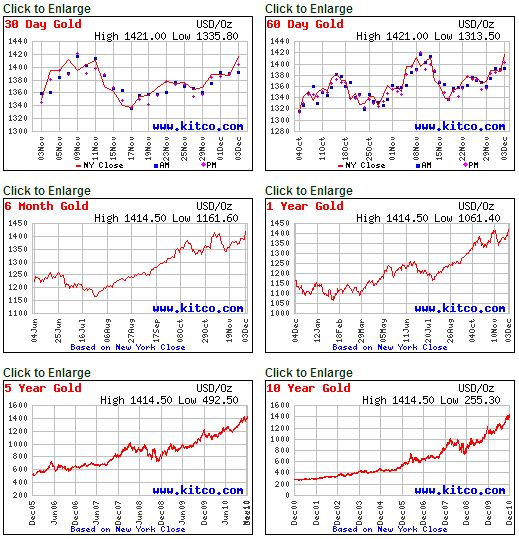
Strong correlation between gold price and the Australian Dollar may give us the clue of the long-term direction of the AUD-USD. As you can see the ever increasing price of Gold, maintaining the bullish strength of Australian Dollar against the US Dollar (AUD-USD). Perhaps this condition could continue for many more years to come if demand for Gold is never fade away. As a result strong possibility that the AUD-USD pair maybe going for the overbought condition. We will see this in few months to come.


Post Office Tracking Renew Antivirus Store

Saturday, May 23, 2009

AUD-USD Technical Analysis (24 May 2009)

AUD-USD recent upward movement is one special case that we cannot predict in forex. By right based on weekly slow stochastic and candlestick counting (weekly time frame) it should move down, but in reality it chose to move up (overbought). This is where many traders can fail if they rely too much on their technical indicators and strategies to predict the market direction.

Even though this phenomena happens occasionally but the impact is like losing frequently. At this point you have no idea if the market will continue the overbought or reverse soon. Throughout my long-time observation i have encountered many situations like this and despite of my familiarity with it still i failed to avoid losses when it happens. This is because i just cannot predict when exactly the market will move.

Therefore sometimes i just use my guts feeling to trade and usually close my position if it is not moving according to my expectation after a certain period of time.

aud-usd technical analysis

Wednesday, April 29, 2009

AUD-USD post analysis

Remember in the beginning of April i was analyzing that AUD-USD will at least form 2 pieces of white candlestick on the major correction. And this analysis was valid throughout all the month of April. Now you can see the result yourself.

Previous Analysis: AUD-USD Technical Analysis (31 March 2009)
Here is the previous candlestick chart in the beginning of April 1, 2009

aud-usd technical analysisBelow is the new chart with another white candlestick formation at the end of April 29, 2009.

aud-usd candlestick chart
Now you can think about how effective is this system, at least showing some accuracy over a month time.

Sunday, April 12, 2009

Forex daily technical analysis - 13 April 2009

EUR-USD

The pair is defying the direction of technical analysis for the rest of last week due to strong fundamental impact on the market. As a result it follows the down trend direction way too early where it should be undergoing correction process between 1.3164 and 1.3711 support resistance level.
As of today it the pair direction is still hanging in the balance without clear direction where it should go. The possibility of moving up or down is still unknown as fundamental influence can easily the market into turbulence. By rights based on technical perspective the pair should be going down gradually at small scale retracement at every twist and turn.
Intermediate Trend (Weekly time frame) - Upside correction
Long trend (Monthly time frame) - Down or bearish trend
Today direction - Unknown (due to fundamental disturbance)

GBP-USD

Likewise the pound-dollar pair also following the same course of direction as eur-dollar during last week movement but in a smaller scale. Unlike eur-usd it is only having a minor correction and still having the chances of moving up to continue intermediate terms retracement.
As of today still we cannot determine the clear direction as fundamental factors i.e. economic data release can affect the movement in any direction. However based on technical perspective we the market should be moving down to 1.4603 level and then continue the intermediate term process upside.
Intermediate Trend (Weekly time frame) - Upside correction
Long trend (Monthly time frame) - Down or bearish trend
Today direction - Unknown (due to fundamental disturbance)

AUD-USD

The only pair between that going the right direction for retracement is this australian dollar-us dollar pair. It follows correctly the intermediate correction process for the rest of last week. You can see this as the market moving upside following the slow stochastic. On weekly time frame candlestick is getting smaller indicating the market is weakening to move further upside. However we will never want to underestimate an overbought situation if the fundamental factors affect the market so much.
As of today we expect correction downward to 0.7142. Or if not then it could be still moving upside to go for overbought.
Intermediate Trend (weekly time frame) - upside intermediate correction
Long Trend (Monthly time frame) - down or bearish trend

Monday, March 30, 2009

AUD-USD Technical Analysis (31 March 2009)

As far as bearish trend is concerned, in the long-term perspective the AUD-USD is always bearish at least for now and perhaps for another year based on Moving Average Convergence Divergence (MACD) indicator downward direction in monthly time frame. In the intermediate trend we can see it is currently having correction and resistance activities going on within the range 0.7133 (upper bollinger band) and 0.6169 (bottom bollinger band).

aud-usd bearish trend candlestick chartaud-usd support and resistance candlestick chart weekly time frameDespite of that concerns, what matters most to us is the intraday or short-term trading where we should make money. So where is going along this month? in order to answer this question i would like to refer back to my previous post in the past about candlestick chart counting.Counting candlestick, Candlestick counting post analysis, EUR-USD post analysis, EUR-USD Technical Analysis.

Based on the observation and back testing results that i have done in the past using candlestick counting we will use it to predict the overall movement of the AUD-USD along the month of April until it reaches the end of the month.
Alright now that we see 1 piece of white candlestick is already formed at the end of March. Since the slow stochastic in the monthly time frame is already iniatially moving upwards there for we expect another 1 piece of white candlestick will be formed again until the end month of April. We will test again the validity of this candlestick counting theory for this month.

If this theory is true, so if the if market is expected to move upside to form another white candlestick until the end month of April. Therefore we can estimate the movement of market within weekly and daily time frame as well. So whatever comes down during the period of weekly or daily must go up and this is valid throughout the month of April.

aud-usd counting candlestick technical analysisLet's observe and give me your feedback what is your opinion on this.

Saturday, October 25, 2008

Forex AUD-USD Technical Analysis

The current scenario of AUD-USD situation is the result of its stubborn long-term bullish effect. The trend was moving up for long years and it shows no stopping sign until it goes overbought. As pay back time came the pair now is in the possession of the bear and the worst case, it is extremely oversold.

At this extreme oversold high certainty of reversal is ultimately imminent, because the big money is held in the hands of the few. As emotions starting to build up they will close their position to harvest profits, which may result in the market creating rapid reversal. Just watch out for monthly slow stochastic movement, if there is any sign to upward direction for this pair. Some others are already anxiously waiting for the big reversal that make up at least minimum total of 500 pips or more.

aud-usd technical analysisMarketiva Forex: Trade as low as $1 & FREE $5 + $10000 Virtual Practice Money

Popular Posts