The movement is now totally out of hand. Volatility is unpredictable and yet it is vigorously moving up and down between support and resistance. In order to do so i have to take a very careful trade to follow the bigger crowds and took every pips possible on the volatility line. We will see next week if the same patterns of movement will happen again. Just wait for the crowds to decide
forex strategy | forex forecast | forex signal | forex signals | forex scalping | BCOUSD | Gold | XAUUSD | Brent Crude Oil | technical analysis | historical data
Sequence of Analysis
1. Let the market stretch
2. Support / Resistance
3. Price Actions
4. MACD / Stochastic
5. Overbought / oversold - two long candle (hourly / 4H / Daily
2. Support / Resistance
3. Price Actions
4. MACD / Stochastic
5. Overbought / oversold - two long candle (hourly / 4H / Daily
Friday, July 31, 2009
GBP-USD Scalping Trade Result 31 July 2009
Thursday, July 30, 2009
GBP-USD Trade Results July 3, 2009
There is no telling when the volatility of support resistance will stop as the pair keep up and down the same level. In this trade i just wait for the crowds to make the move and try to ride the boat together at every crucial point. The game is just playing along support resistance level.
However there is one advice just don't get caught with the big move. Otherwise it's too late and the losses is big or wasting your time waiting.
Wednesday, July 29, 2009
GBP-USD Strong Support & Resistance
Along this week still there is no clear indication to where will the GBP-USD is heading to. Strong volatility movement along the 4 hourly time frame Bollinger band indicator making it very difficult to guess the intention of the big crowds.
Based on Daily time frame there is a likelihood, it should move down to the bottom of the bollinger band in daily time frame. From past historical analysis I have a strong opinion that it should move down to 1.6104 support level at least for this week. Then move up again to retest 1.6563 by next week.
We will see if my opinion is correct along this week.
Marketiva Forex: Trade as low as $1 & FREE $5 + $10000 Virtual Practice Money. Liberty Reserve, Webmoney, e-Dinar. The best practice account for forex beginner.
Thursday, July 23, 2009
USD-CAD & GBP-USD connection technical analysis
A significant correlation between USD-CAD and GBP-USD can be a very important indicator that both pairs is near it's end of movement. As you can see MACD, Slow Stochastic, and Bollinger Band each of the indicators has reach a significant point where resistance is strong enough to hold them not to move any further. Below is my analysis of both pairs
USD-CAD (Monthly Time Frame)
Moving Average Convergence Divergence = Still moving upward (waiting for continuation)
Slow Stochastic = Move downward (major retracement line)
Bollinger Bands = Middle Band Position. This is an ideal position for the first retracement, that's why the resistance should hold here stronger
GBP-USD (Monthyl Time Frame)
Moving Average Convergence Divergence (MACD) = Move downward (waiting for continuation)
Slow Stochastic = Moving Upward (major retracement line)
Bollinger Bands = Middle Band Position. An ideal position for first retracement, and resistance is strong to prevent the pair to move any further.
So the conclusion of this analysis is to use the correlation of the two pairs (USD-CAD & GBP-USD) as a guide to predict the movement of each when one is moving on its direction. As long as USD-CAD is moving downward, the likelyhood of the GBP-USD to continue upward is also strong. However if the USD-CAD start to reverse (upward movement) based on the above analysis then GBP-USD also will reverse to the opposite direction (downward movement).
We will see the impact of this correlation when the major market movement start to take effect on both market.
GBP-USD Trade Results - July 23, 2009
Thursday July 23, 2009 trade results for forex experiment and testing is below. I have to scalp based on MACD and price actions activities. The updwards direction is dangerous path to follow as it can fall, in sudden. However for the good of experiment and testing i can do it with careful trade to evaluate the market movement.
It works perfectly.
The idea is simple, as MACD monthly time frame is still moving upwards i expect that the market might move a little bit higher than 1.6744 (previous resistance) when the weekly slow stochastic start to move upward again. We will see if it happens this week or next week.
Wednesday, July 22, 2009
GBP-USD Trade Results - July 22, 2009
Today's trade result is based on MACD strength and also close observation of the price movement. As the market is hanging in the balance i have to take a little bit of luck by depending on the MACD direction upwards to harvest some pips on the minor resistance level in the hourly time frames.
Nothing we can guarantee on this stage only luck can help. As big time movement might be just aroound the corner to move up or down. It is just a matter of time that no one can know where it is heading to next.
Marketiva Forex: Trade as low as $1 & FREE $5 + $10000 Virtual Practice Money
Kaspersky Internet Security 2009 (1 User/1 Year) - USD 8.50 and (3 Users/1 Year) - USD 12.00. Bit Defender, Nod32, McAffee, Anti Virus, Internet Security Software, Wholesale price, supplier, dealer, distributor, agent, cheapest kaspersky.
Tuesday, July 21, 2009
GBP-USD Technical Analysis
This is my first post after a long months of absence. Today i will discuss about GBP-USD technical anaysis, a very difficult position to predict as all directions are possible. Just beware of the big movement, either ups or downs will be depend on the fundamental data that we do not know.
Currently the position is hanging on the balance moving to either directions way up, down, sideways are all possible. It is just a matter of time based on the speculation of economic data release, the market may move big time but the direction is highly unknown. This analysis is based on weekly time frame as we are looking at the long-term movement of the forex market.
Upward Market Direction Probabilities
Based on Moving Average Convergence Divergence (MACD) direction and behavior the market still have the power to move upward direction if the crowd speculate based on the economic data. That is something that we cannot predict at all because economic data is can be very tricky, even it release according to expectation it does not necessarily make the market move according the expected direction.

In the weekly time frame the market is already reach its ideal resistance level and testing whether to break or rebound downwards it will be purely based on speculation of traders. On this position we can see that MACD and slow stochastic is moving on the opposite direction. This means that the market is power balance, some are thinking the market is still moving up (based on MACD weekly time frame direction) whereas others are speculating that the market is moving down (based on slow stochastic direction weekly time frame). So as a result of this the power balance can create a sideways direction until it reaches the simple moving average line on weekly time frame bollinger bands.

Slow stochastic direction is down (weekly time frame), therefore many of the short-term traders are actually expecting the market to move down. Never ignore this signal as it is proven time and again, slow stochastic can make a very big impact to the market movement if the speculators agreed to the economic data release.
There is no telling the market move up, down, or sideways. All will depends on the fundamental factors. We will wait and see where will the big crowds are heading to.
Currently the position is hanging on the balance moving to either directions way up, down, sideways are all possible. It is just a matter of time based on the speculation of economic data release, the market may move big time but the direction is highly unknown. This analysis is based on weekly time frame as we are looking at the long-term movement of the forex market.
Upward Market Direction Probabilities
Based on Moving Average Convergence Divergence (MACD) direction and behavior the market still have the power to move upward direction if the crowd speculate based on the economic data. That is something that we cannot predict at all because economic data is can be very tricky, even it release according to expectation it does not necessarily make the market move according the expected direction.
Sideways Market Direction Probabilities
In the weekly time frame the market is already reach its ideal resistance level and testing whether to break or rebound downwards it will be purely based on speculation of traders. On this position we can see that MACD and slow stochastic is moving on the opposite direction. This means that the market is power balance, some are thinking the market is still moving up (based on MACD weekly time frame direction) whereas others are speculating that the market is moving down (based on slow stochastic direction weekly time frame). So as a result of this the power balance can create a sideways direction until it reaches the simple moving average line on weekly time frame bollinger bands.
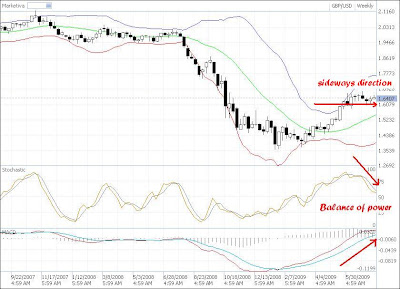
Downward Market Direction Probabilities
Slow stochastic direction is down (weekly time frame), therefore many of the short-term traders are actually expecting the market to move down. Never ignore this signal as it is proven time and again, slow stochastic can make a very big impact to the market movement if the speculators agreed to the economic data release.
Conclusion
There is no telling the market move up, down, or sideways. All will depends on the fundamental factors. We will wait and see where will the big crowds are heading to.
Subscribe to:
Posts (Atom)
Popular Posts
-
MACD Settings:- First EMA = 12 | Second EMA = 26 | Signal EMA = 9 Stochastic Settings:- Period = 5 | Average Period Fast = 7 | Average Pe...
-
Trade result for EUR-USD and AUD-USD on the 4th June 2016 As expected the EUR-USD and AUD-USD should go for major correction after an ex...
-
Let's take a look at the historical chart of the major currencies traded in Forex over the course of 37 years period since 1978 until pr...
-
The movement is now totally out of hand. Volatility is unpredictable and yet it is vigorously moving up and down between support and resista...
-
Strong bearish signal has pushed the EUR-USD deep to oversold position, but is it going to stop soon when the Euro Zone market open or conti...
-
MACD Settings:- First EMA = 12 | Second EMA = 26 | Signal EMA = 9 Stochastic Settings:- Period = 5 | Average Period Fast = 7 | Average Pe...
-
MACD Settings:- First EMA = 12 | Second EMA = 26 | Signal EMA = 9 Stochastic Settings:- Period = 5 | Average Period Fast = 7 | Average Pe...
-
EUR-USD trading last Friday 19 Feb 2016. There is a strong sentiment the EUR-USD might be heading for major correction upside as the MACD an...
-
MACD Settings:- First EMA = 12 | Second EMA = 26 | Signal EMA = 9 Stochastic Settings:- Period = 5 | Average Period Fast = 7 | Average Perio...
-
MACD Settings:- First EMA = 12 | Second EMA = 26 | Signal EMA = 9 Stochastic Settings:- Period = 5 | Average Period Fast = 7 | Average Pe...