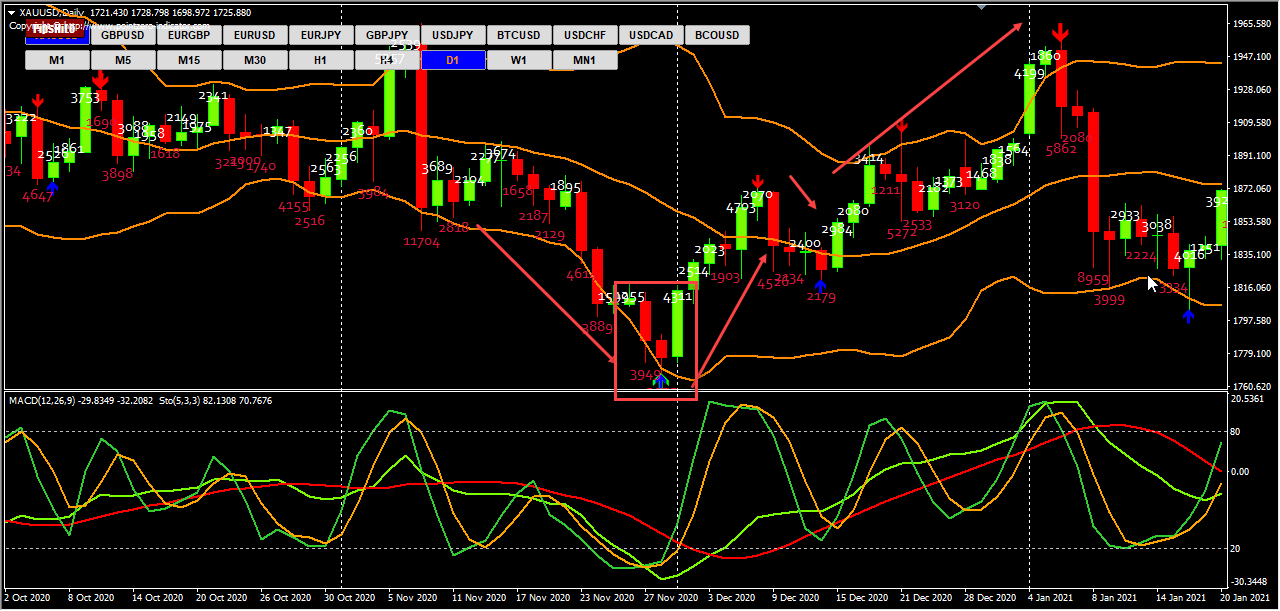
Here are similar historical data that happens in the 26- to 01 December 2020
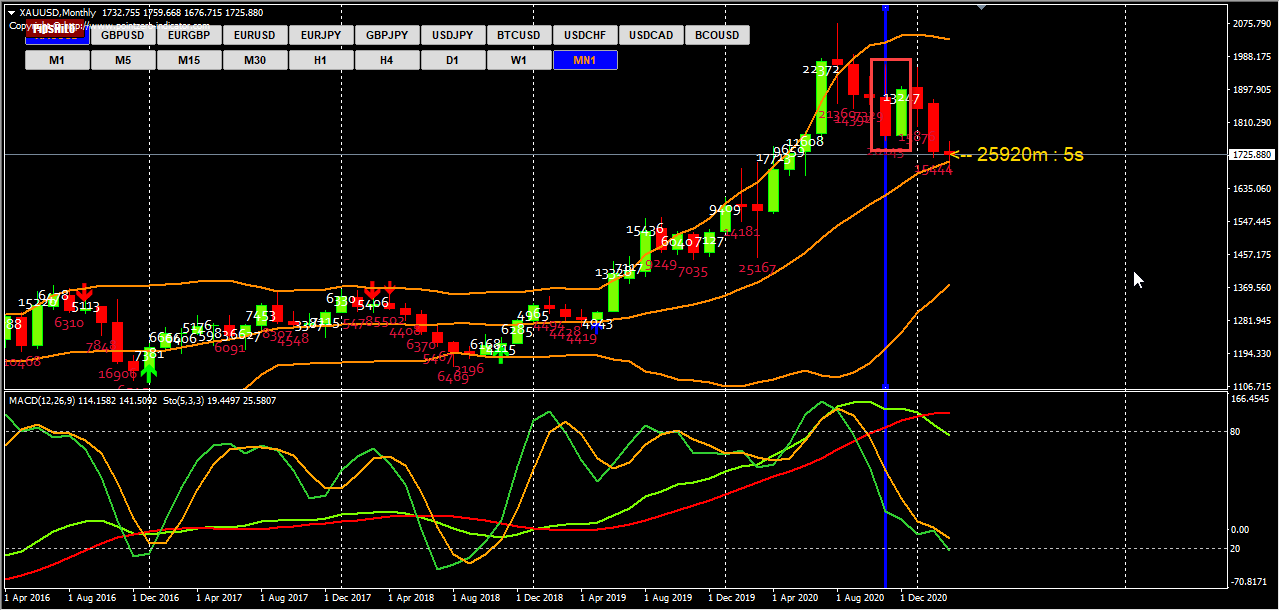
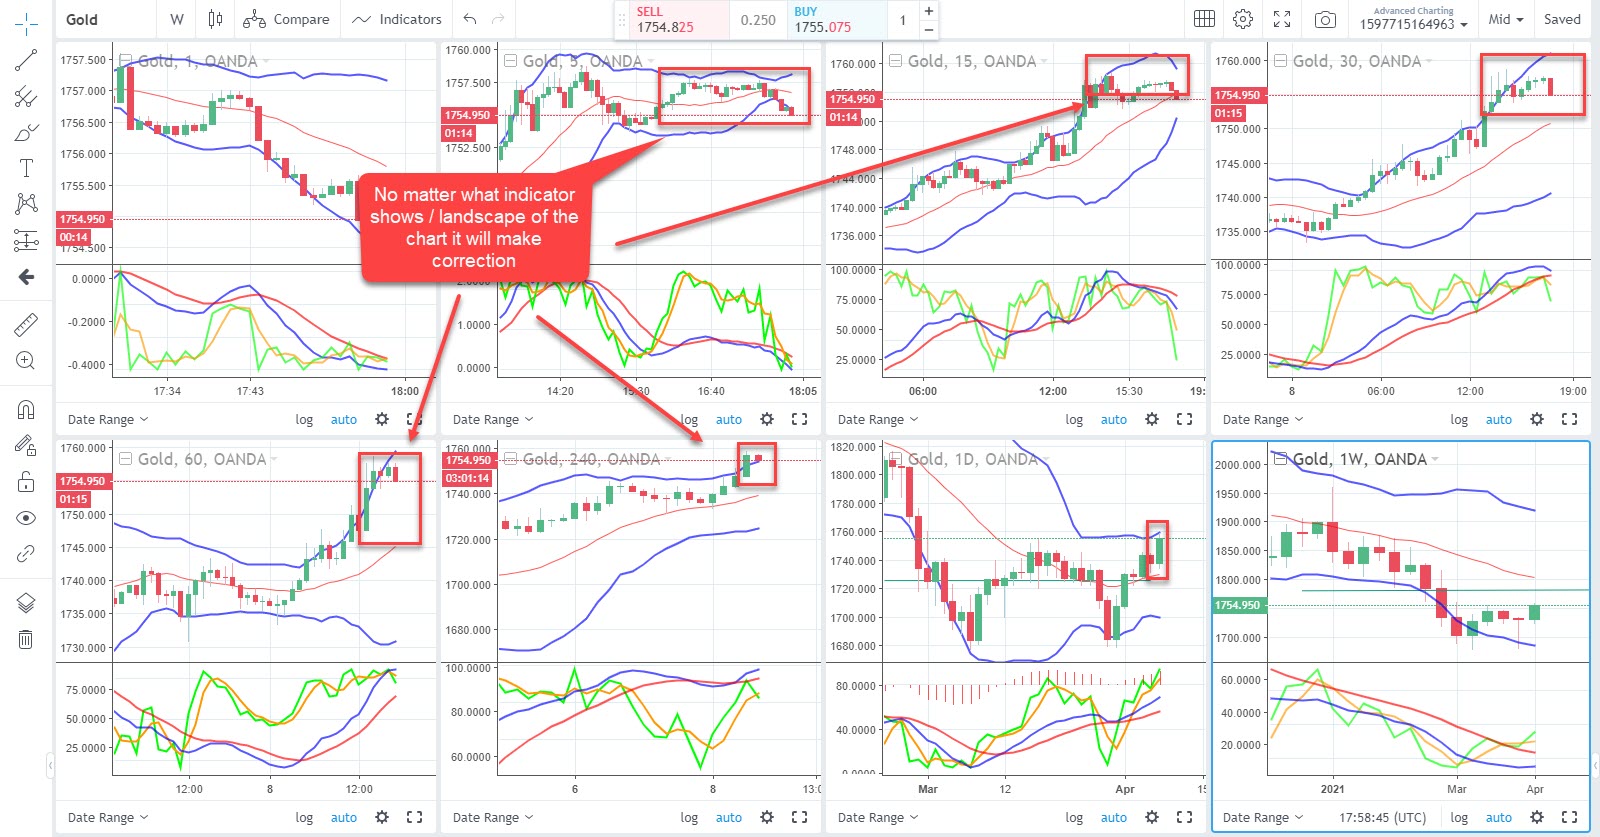
Let's if there is truth in chart patterns of the Gold XAUUSD - and how it behaves in different situation of the MACD indicator in different time frame
Updated - it goes up as expected
Updated 03-Mar-2021 - So history prove itself right once again the Gold wen't up just exactly like historical of similar patterns. Now let's see on the 4H time frame if history is right once again to break the resistance.
Updated 03-Mar-2021 - So it didn't break the resistance and quickly reverse (History goes differently for how much it should go up)
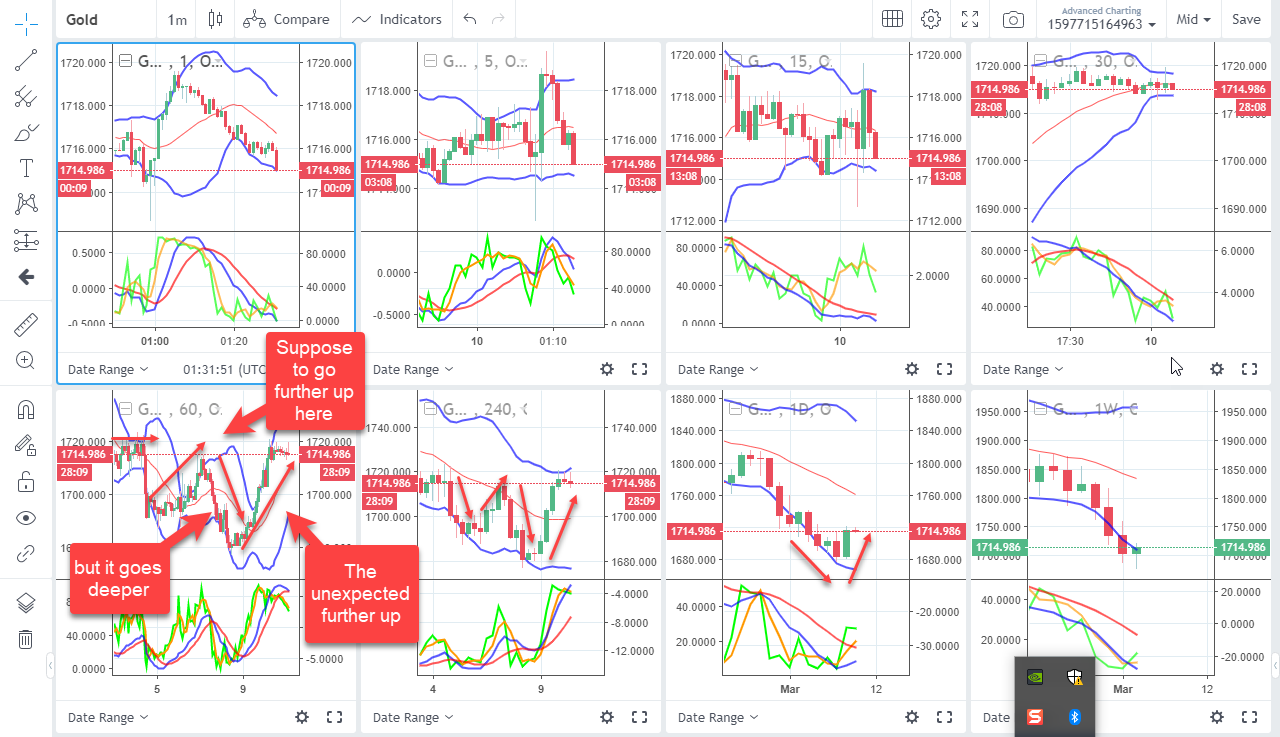
Updated 09-Mar-2021 - It goes further deeper but reverses now the fight change to daily time frame
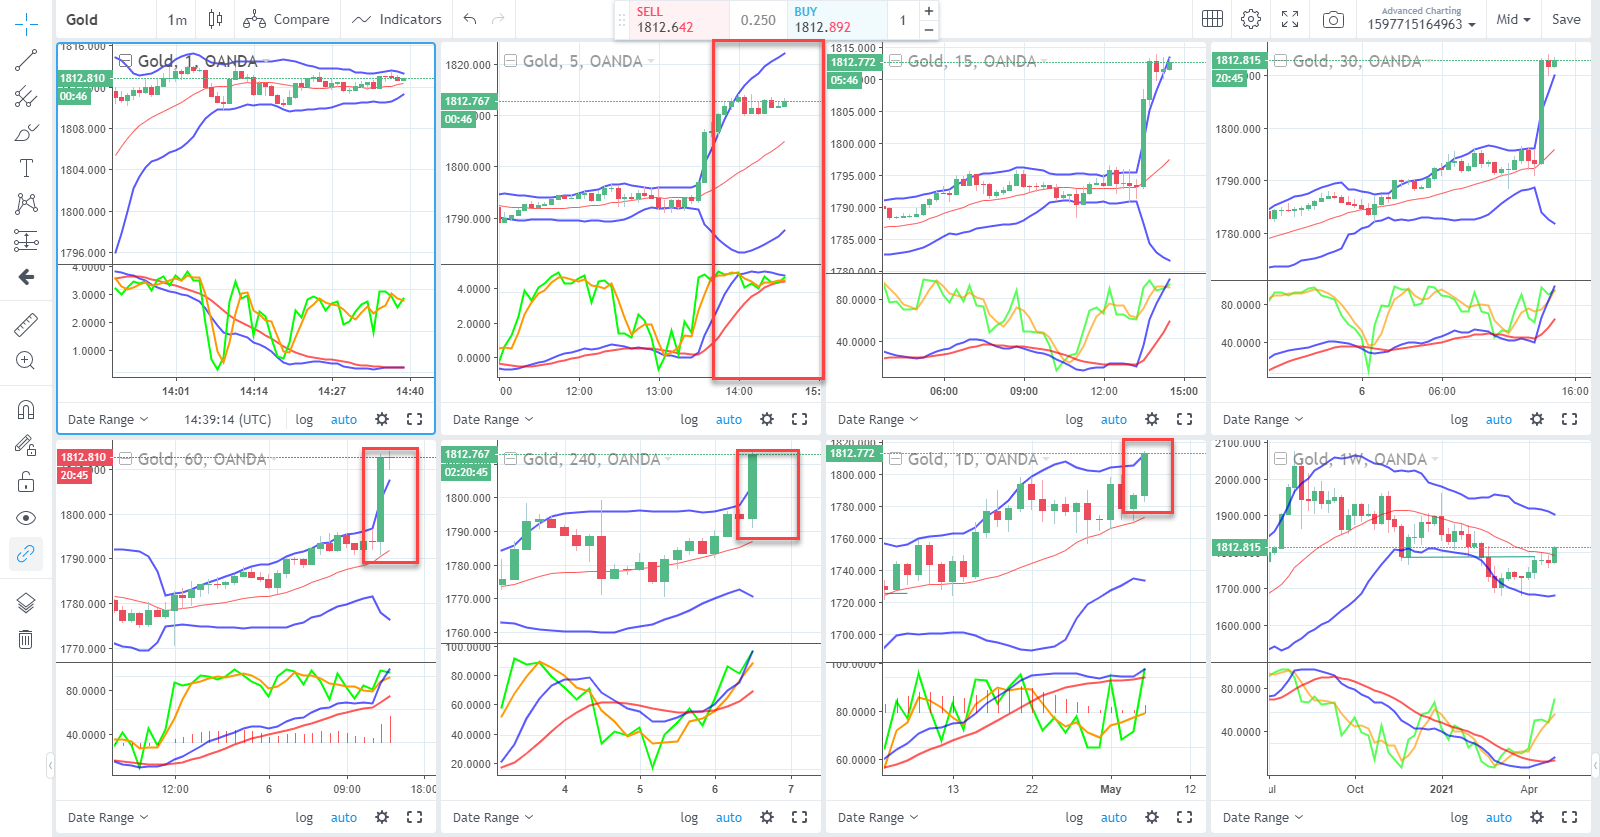
Updated 10-Mar-2021 - The unexpected upside has occur after it went deeper now it suddenly goes up and break the resistance that should be broken earlier based on historical data. The patterns of fluctuation seems to play on slighly different landscape.
Updated 11-Mar-2021
Updated 11-Mar-2021 - it went up hit the resistance on the daily time frame and quickly reverse
Updated 12-Mar-2021 - The reversal went deep
Updated 13-Mar-2021 - Quick reversal (This is game of support / resistance (not price action or MACD anymore)
Updated 15-Mar-2021 familiar formation
Updated 18-Mar-2021 Painful gradual upside with high active fluctuations - very small scale movement and dangerous. So the prediction was right just that it looks painful and high emotional play
Updated 22-Mar-2021
Updated 23-Mar-2021
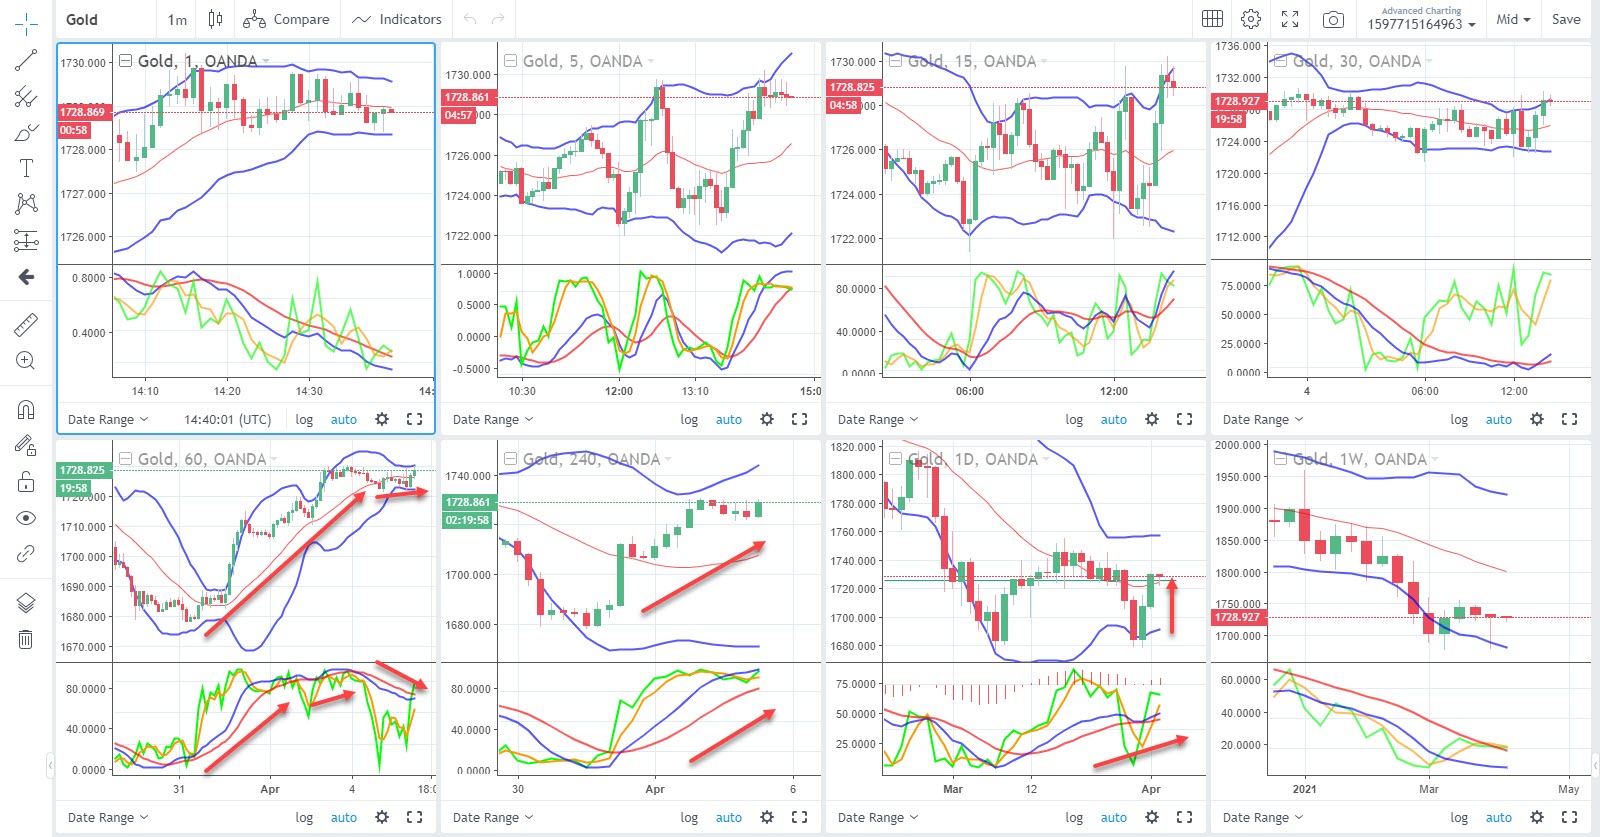
Updated 01-April-2021
Updated 02-April-2021 -- So it keeps moving up like BCOUSD historical data and reverse when there is big leap in price.
Updated 05-Apr-2021
Updated 07-Apr-2021
Updated 09-Apr-2021
Updated 13-Apr-2021 --- A different style of trading this time. Based on Ups and Downs without relying too much on indicators
Update 15-Apr-2021
Updated 15-Apr-2021
Updated 20-Apr-2021
Updated 24-Apr-2021
Updated 28-Apr-2021
Updated 28-Apr-2021
Updated 06-May-2021
Updated 11-May-2021
Updated 17-May-2021
Updated 20-May-2021
Updated 21-May-2021
Updated 24-May-2021
Updated 03-Jun-2021
Note: Monthly MACD Down
Updated 04-Jun-2021
Note: Monthly MACD Down
Updated 15-Jun-2021
Note: Monthly MACD down
Updated 18-Jun-2021
Note: Monthly MACD down