In the larger institution like banks, hedge fund, and big trading company they are able to record all these in the form of statistical records using automated software. Therefore they have the advantage to study more detail picture of twist and turn in the market in the smallest time frames possible. And because of that they are better than individual traders. Unfortunately for us individual traders we have to build our own statistical record on manual basis where it requires time and efforts to do it. So in order to make our trading decision simple we just rely on indicators that we believe work effectively and ignore the recording part.
Why should we record indicators' behavior, chart patterns, and price history? It is to increase our understanding on of the effect on indicators on the overall market behavior and chart patterns as well as familiarizing ourselves on the unpredictable area of the market.
Indicators Behavior and Chart Patterns Formation
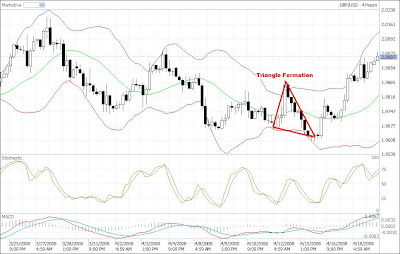
If you have studied the market as in-depth manner you should be able to identify that there is relationship of the technical indicators behavior and the chart patterns such as double tops/bottoms, head and shoulders, or hell's triangle. Especially MACD and Stochastic have so much impact on the chart patterns formation.
As discussed before that the stochastic move faster than MACD but unable to build a solid movement without the MACD indicator. Because of this reason stochastic alone moving in opposite direction of MACD only give you a temporary move in which eventually later it will return to the place where it started. As a result it will create a double tops/bottoms, head and shoulders, or hell's triangle. See the chart…
Notice that at major resistance level on the GBP-JPY downtrend when stochastic moving alone downwards the chart did not make continuation of the trend but instead return back to the same support level to form double tops (M shape). And then when both MACD and Stochastic moving downwards the trend start to continue moving to the next level of support and resistance. This is also apply to the to double bottoms (W shape) formation.
The concept of head and shoulders is very similar to the double tops/bottoms and the only difference is the middle movement higher creating a chart that look like a head and shoulders figure. This happens because the stochastic is unsuccessful to move alone downward and instead making the continuation even higher when the chart it is moving along the MACD line again. And after that stochastic test again the resistance level until it eventually when MACD starting to show downward direction. As both move down it will create strong movement downwards.
The hell's triangle can most bee seen during the non-farm payrolls data release because traders trying to make quick profits. The market usually go ups or downs in high volume but temporary and eventually return to the normal movement. Sometimes it happens also in normal movement where MACD movement relatively weak.
The chart patterns formation also associated to the price historical movement. When all indicators seems to fail to notice where exactly the price will stop moving just take a glance to look at the previous target where it has been reached. There you will find that it might stop somewhere within the same level of the previous target. That's where you will find the overall patterns will form double tops/bottoms, head and shoulders, or hell triangle.
The Number of Peaks/Troughs in resistance Area
Have you ever thought of making studying the number of peaks and troughs created in every major support and resistance level? If you have not yet done that let's take a look at how many of them within support and resistance area. See chart…
Notice that the repeatable patterns generally form the identical number of peaks and troughs at every resistance level. The importance of taking note the number of peaks and troughs is to provide the traders general idea how many times the market will fluctuate whenever the market rest at the major support and resistance level before any continuation or reversal takes place. This will give them precision counts and make sure the market move according to their decision.


No comments:
Post a Comment