I am going to use 3 of the following indicators
- Bollinger Bands – To determine support and resistance level
- Slow Stochastic – To determine the short-term movement
- MACD – To determine the overall movement
Put them in a table. I am going to use GBP-JPY to make the explanation specific.
The initial setup will start from the top of the Bollinger bands for monthly time frame and our expected target is at the bottom of the Bollinger bands. Assume that the first move all stochastic and MACD in all time frames moving downward.
According to the natural movement that it must move and past through support and resistance level before any movement reaching its target. These are obstacles we have to consider so that we can utilize the situations to our favor.
The monthly time frame is a long time to wait especially when it comes to support and resistance level it will take months to break before moving to the next level and continue to the targets. Based on the GBP-JPY chart it takes approximately nearly a month or more to successfully battling each of the obstacles along the way.
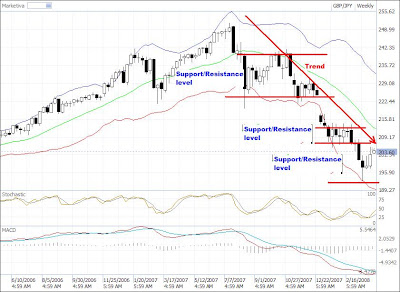
Now the question is how do we determine the support and resistance level? The key is the weekly time frame which is the closest to monthly time frame. Therefore the strongest support and resistance area will be created when the weekly stochastic is moving upwards. The rest of the minor time frame 1H, 4H, Daily will be easily broken because they cannot stand the long-term traders power. These minors time frame will be active again to create volatile price movements at the support and resistance level.
Upon reaching the strongest resistance level weekly stochastic will move upwards heading toward the middle Bollinger bands. It will sometimes reach the middle but most often not exactly. However on the daily time frame target will be exactly in the middle or a little bit more because both daily MACD and Stochastic are moving parallel upwards. Upon reaching the highest point, this will create the limit peak for fluctuation for the support. Based years of observations i've come to note that the market will generally fluctuate to create 3 peaks in sideway direction before breaking the resistance level to continue the trend downward. As you can see on the chart below.
Keep in mind that the overall trend is still going down as MACD and stochastic monthly time frame is still go downwards direction. This is to reduce the amount of doubts to think the trend might reverse upside suddenly. Don't be afraid of the reversal because every trader including those with the most money also fears that they will lose money if they go against the market direction.
The next setup will be located in the middle and as the slow stochastic moving downwards it is definitely going to move down to the bottom of the weekly time frame trying to break the resistance level. When it is broken the trend will move down until it reaches the next resistance level when the weekly stochastic start to move up again. At resistance level fluctuation start to occur again before make any continuation.
This process will go on and on until it reaches the monthly bottom Bollinger bands. After that then the market will retrace to the middle of the monthly time frame. If you want to be good in this you need to practice to look at the market behavior based on these three indicators you will be improving better in your trading. This system is based on the mathematics of moving average, where it round up the best average from all trading activities.
If you have any confusion or in-depth questions about this system leave me your thoughts on the comment i will try to help as much as i can.


No comments:
Post a Comment