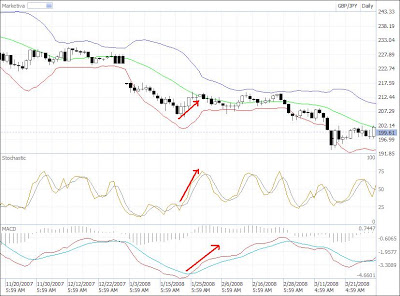
Supposed that the initial Bollinger band position is at the bottom and both MACD and slow stochastic is about to move in the same parallel direction upwards. So the potential profit target is somewhere around the middle or higher of the daily the Bollinger band.
If the initial position of the B. band start from the middle and both MACD and slow stochastic is up the then end target should reside somewhere in the upper band or higher of the daily time frame.
This discussion only covered the single daily time frame without considering other higher time frame i.e. weekly and monthly. If multiple time frame involve there should be slightly different in target profit of setting because of the effects. However not to worry about that because based on the research that I've done for a year now a single time frame is somehow adequate enough for good analysis.
Try to practice this method on your chart for example using 4 hourly or hourly time frame see what you will get and tell me here in my blog if anything goes wrong.


No comments:
Post a Comment