MACD Settings:- First EMA = 12 | Second EMA = 26 | Signal EMA = 9
Stochastic Settings:- Period = 5 | Average Period Fast = 7 | Average Period Full =7
Bollinger Bands Settings:- Average = 20 | Standard Deviation = 2
Date: 27 October 2014
Time: 9:09 PM (+8 GMT)
| EUR-USD | ||||
|---|---|---|---|---|
| Technical Indicators | 4 Hourly | Daily | Weekly | Monthly |
| MACD | UP | UP | DOWN | DOWN |
| Full Stochastic | DOWN | DOWN | UP | DOWN |
| Bollinger Bands | N/A | N/A | N/A | N/A |
| Chart Formation | Sideways | N/A | N/A | Wedges Down |
| Market Direction | NEUTRAL | NEUTRAL | NEUTRAL | DOWN |
| Market Comments | Short terms = Sideways | Intermediate = Correction | Long Term = Down | |||
Looking at the broader perspective in the monthly time frame, the Euro-Dollar pair is moving downward sideways. As you can see there are 3 major peaks in the form of falling wedges formation. This is one of the common shape that you find in all historical graph of chart formation. The 4th peak marked the re-testing point of the previous correction level as shown below. At the current position now, there is strong possibility the EUR-USD may go deeper down to test 1.2175 level.

Having MACD and Full Stochastic indicators in contra-direction in the intermediate terms, a minor sign of correction could be underway where 1.2876 is the most likely level to reach. Having said that the USD economic data seems to be dominating throughout the week which could support the acceleration of the pair downfall but that is only if the expected results are better than previous and forecasted.
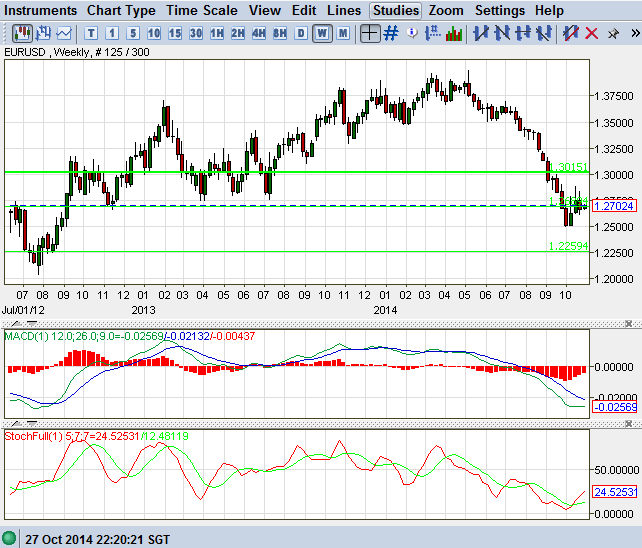
On the short-term perspective both MACD and Full stochastic (Daily | 4 Hourly) are moving against each another indicating the sign of sideways movement with the risk of correction up to 1.2879. Anything can happen at this point as the market will fluctuate within the range of 1.258 and 1.2826.

Let's see what the open position indicators within the short-range of trading. Read Here how to use the open position indicator. As you can see the summary of open position below the EUR-USD is very much neutral as both buyers and sellers are holding their position not even exceeding reaching range of 60% which interpret the power of bulls and bears are virtually the same.
| EUR-USD | ||
|---|---|---|
| Sentiment Index Indicator Provider | Buy | Sell |
| OANDA | 53% | 46.95% |
| Dukas Copy | 51.91% | 48.09% |
| DailyFx | 54% | 46% |
| Forex Factory | 47% | 53% |
| Saxo Bank | 58.19% | 41.01% |
| Alpari | 51% | 49% |


No comments:
Post a Comment